This web page was produced as an assignment for Genetics 564, an undergraduate course at UW-Madison
Protein Phylogeny
Phylogenies are constructed to indicate the relatedness of a set of organisms. In this case, the amino acid sequences of proteins are entered and their similarities used to determine which are most likely to have close common ancestors. Parsimony, or Occam's razor, is the idea that the simplest explanation used to get to the solution is usually the right one [1]. This is applied to phylogenetics by assuming that the sequences with the least number of amino acid substitutions are likely the ones that are most closely related through evolution.
Analysis
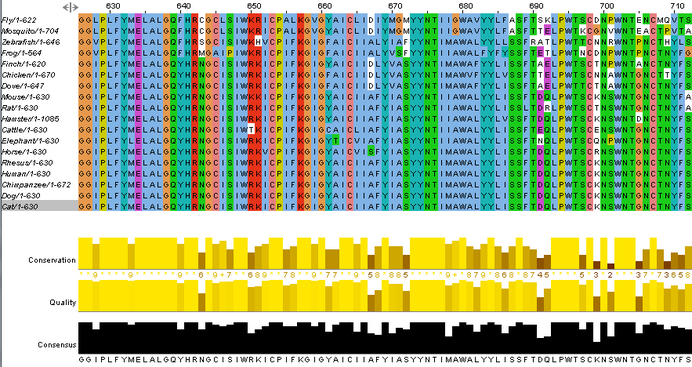
All protein sequences for the homologs listed above were used to construct a sequence alignment as well as several potential phylogenetic trees. ClustalOmega was used to perform the algorithms necessary for these constructs. Starting with the sequence alignment, all protein sequences had to be entered into a text file following a specific format so that ClustalOmega would interpret the data correctly. A sample document with the correct format is shown below.
This document can be pasted into ClustalOmega and the protein sequences will be aligned to the best of the program's ability. The output shows the aligned sequences with different coloring options such as hydrophobicity, percentage identity, and helix propensity among others, as well as the conservation, quality, and consensus at each position of the alignment.
After the sequence alignment has been generated, ClustalOmega gives the option to calculate a phylogenetic tree. The trees can either be Average Distance or Neighbor Joining trees, using Percent Identity or BLOSUM62 analysis methods. Percent Identity compares the sequences and looks at how similar they are compared to each other to determine the percent of bases that are identical between two strands [2]. In contrast, BLOSUM62 uses a distance matrix to score two aligned sequences based on the amino acid substitutions that occur between them. Those with the least substitutions or substitutions between similar amino acids have the lowest scores [3]. Each of these can then be used to build one of trees. Average Distance trees are structured so the sequences most similar to each other are organized with more recent common ancestors. The branch lengths are measured based on how many differences are found between the sequences, assuming that they diverged equally from the common ancestor [4]. Neighbor Joining trees begin with a single node and sequences are grouped together to generate the tree with the shortest branches. Branches are different lengths because it is not assumed that they have diverged equally from their common ancestor and therefore may have different mutation rates over time [5] . All four trees as they were constructed in ClustalOmega can be seen below.
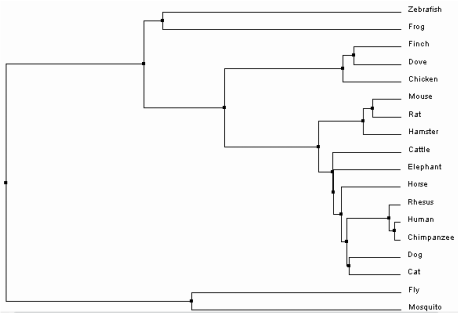
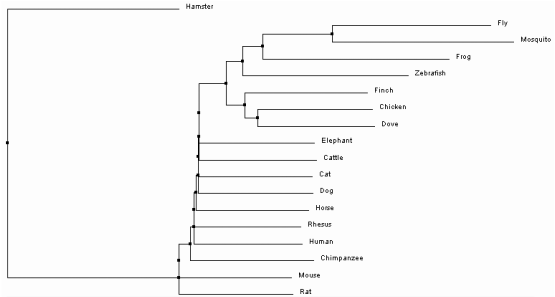
Average Distance Tree using Percent Identity |
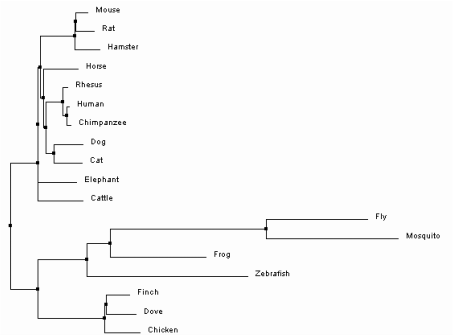
Neighbor Joining Tree using Percent Identity
|
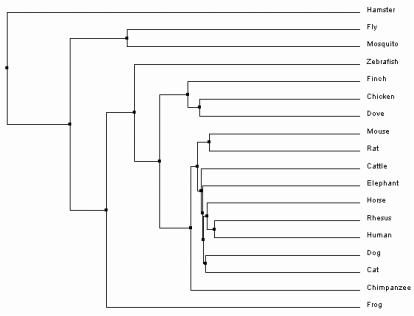
Average Distance Tree using BLOSUM62
|
Neighbor Joining Tree using BLOSUM62 |
Discussion
Just as the gene-based phylogenetic trees, it appears that the Average Distance trees using Percent Identity is the most likely option. Both trees using BLOSUM62 put Cricetulus griseus as the outgroup. Cricetulus griseus is in class Mammalia but has been separated from the rest of the mammals in these two trees, which is highly unlikely from an evolutionary standpoint. The Neighbor Joining tree using Percent Identity suggests insects such as Drosophila melanogaster and Culex quinquefasciatus evolved after amphibians and fish, which contradicts previous evolutionary studies. The Average Distance tree using Percent Identity is the only one that places insects in the outgroup and the rest of the fish, amphibians, and mammals on the other side of the tree. Humans and non-human primates emerge in the most recent past, which is expected [6].
References
ClustalOmega: http://www.ebi.ac.uk/Tools/msa/clustalo/
[1] Definition: Occam's Razor. (n.d.). Retrieved March 20, 2015, from http://www.merriam-webster.com/dictionary/occam's razor
[2] Tree Calculation. (n.d.). Retrieved March 21, 2015, from http://www.jalview.org/help/html/calculations/tree.html
[3] Eddy, S. (2004). Where did the BLOSUM62 alignment score matrix come from? Nature Biotechnology, 22, 1035-1036. Retrieved March 20, 2015, from http://www.nature.com/nbt/journal/v22/n8/full/nbt0804-1035.html
[4] Matsen IV, F., Gallagher, A., & McCoy, C. (2013). Minimizing the average distance to a closest leaf in a phylogenetic tree. Systematic Biology, 62(6), 824-824. Retrieved March 21, 2015, from http://connection.ebscohost.com/c/articles/95728315/minimizing-average-distance-closest-leaf-phylogenetic-tree
[5] Saitou, N., & Nei, M. (1987). The neighbor-joining method: A new method for reconstructing phylogenetic trees. Mol Biol Evol, 4(4), 406-425. Retrieved March 20, 2015, from http://mbe.oxfordjournals.org/content/4/4/406.short
[6] History of Life on Earth. (2014, October 1). Retrieved March 21, 2015, from http://www.bbc.co.uk/nature/history_of_the_earth
